SeeDegree UX Design Project
In the Spring of 2024, our team at Tufts University collaborated with the online advisor platform SeeDegree to improve the user’s experience when utilizing their digital product.

Who is SeeDegree?
-
This beginning phase of our project includes the research and initial interviews that went into fully understanding the SeeDegree product and the space for advising platforms.
-
Upon gathering outside knowledge and information, our team brainstromed ideas for how to improve SeeDegree’s current product. We created basic wireframes from these ideas.
-
After speaking with our clients, we molded our prototype according to their advice and ideas. We tested this prototype and made changes based on testing.
-
After much input from test participants, the SeeDegree final product was finalized for presentation after a sixteen-week period.
-
This conclusion aids in showing overall findings and potential next steps that can be taken in order to further the development of the SeeDegree product.
SeeDegree is a higher education holistic advising platform that strives to provide advisors with a holistic view of their students.
Students take a customizable survey provided by their school/advisor and the results are presented to the advisor in their SeeDegree portal.
Students answer questions related to the social-cognitive theory which shows the advisors what aspects of their life they find important, but also what they believe their strengths and weaknesses are among these aspects.
However, this advisor-facing presentation of information from these completed surveys needs some work in terms of presenting students’ information to achieve SeeDegree’s objectives.
What is our project objective?
Create a tool to enable advisors to save time and gain deeper insights into students’ needs, fostering more effective holistic advising.

SeeDegree Initial Interface


Our Final Product Overview
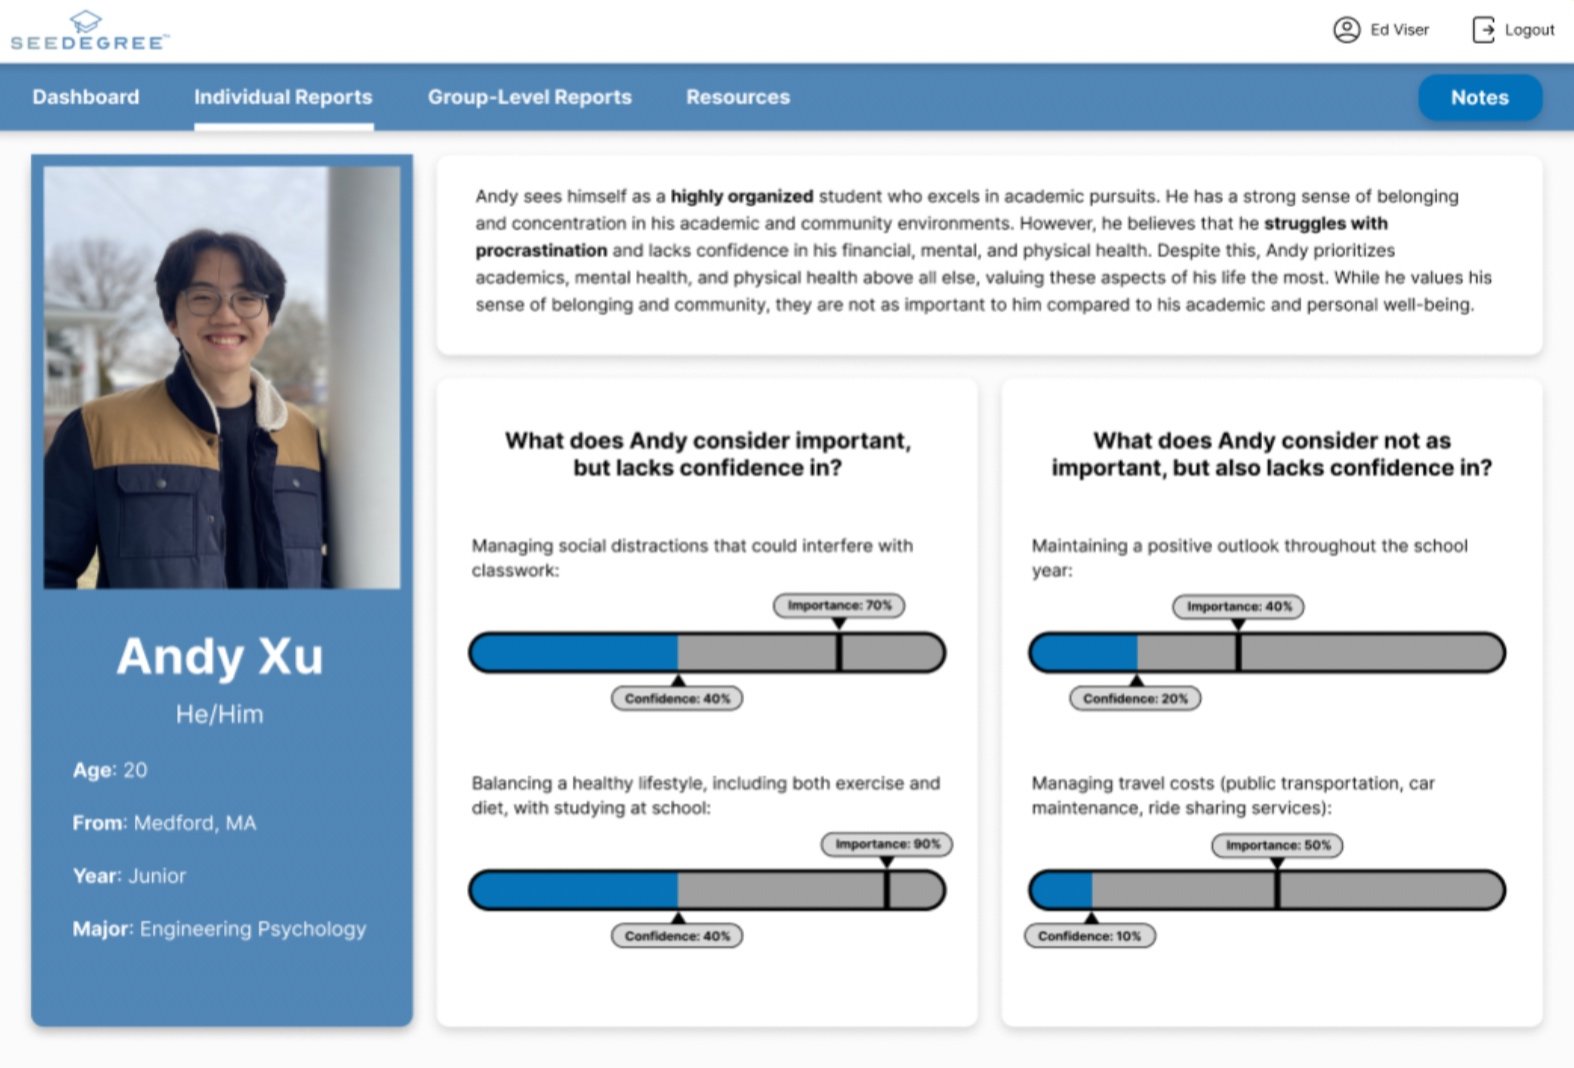
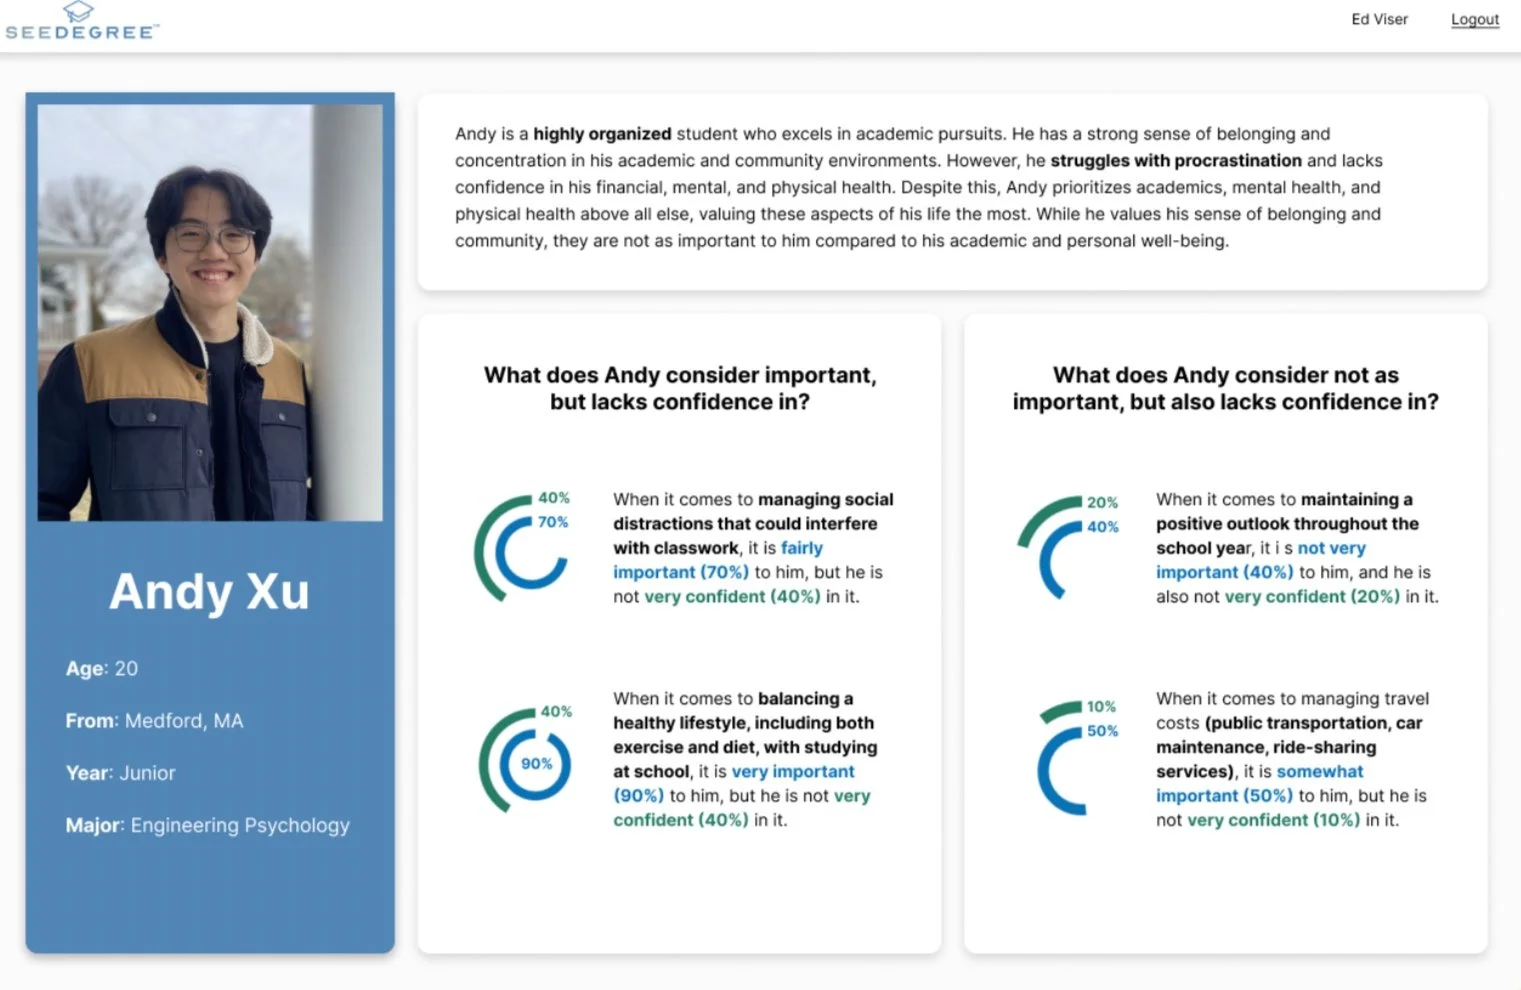
Individual Student Report
Group Level Report
Phase 1: Research
Initial Surveys
Our team conducted initial surveys to see what parents and students valued in the academic advising experience in order to gauge how these opinions of the student and their parents may apply to how we develop the SeeDegree interface later on for the advisor.
Literature Review
Our team conducted a literature review on the literature provided to us by the SeeDegree team in order to gain a deeper understanding of the social-cognitive theory they base their product on.
Competitive Analysis
Our team partook in competitive research to see what similar digital advising platforms were offering in their product. We then discussed features of differing companies’ products to come to solutions that could help inspire solutions for the SeeDegree platform.
Upon meeting with our clients at SeeDegree, we gained a greater sense of how SeeDegree operated and how they wanted us to improve their product. We took it upon ourselves to research the current digital advising market and test their current product to find existing strengths and weaknesses.
User Interviews
We conducted user interviews with academic advisors, an academic dean, and an academic coach to determine what features were important to them in an advising platform for their various roles. We compiled these results into a combined users’ needs list, which helped guide us in our ideation and design phases.
Phase 2: Ideation
Initial Ideations: Individual Report
Text summary overview of the student
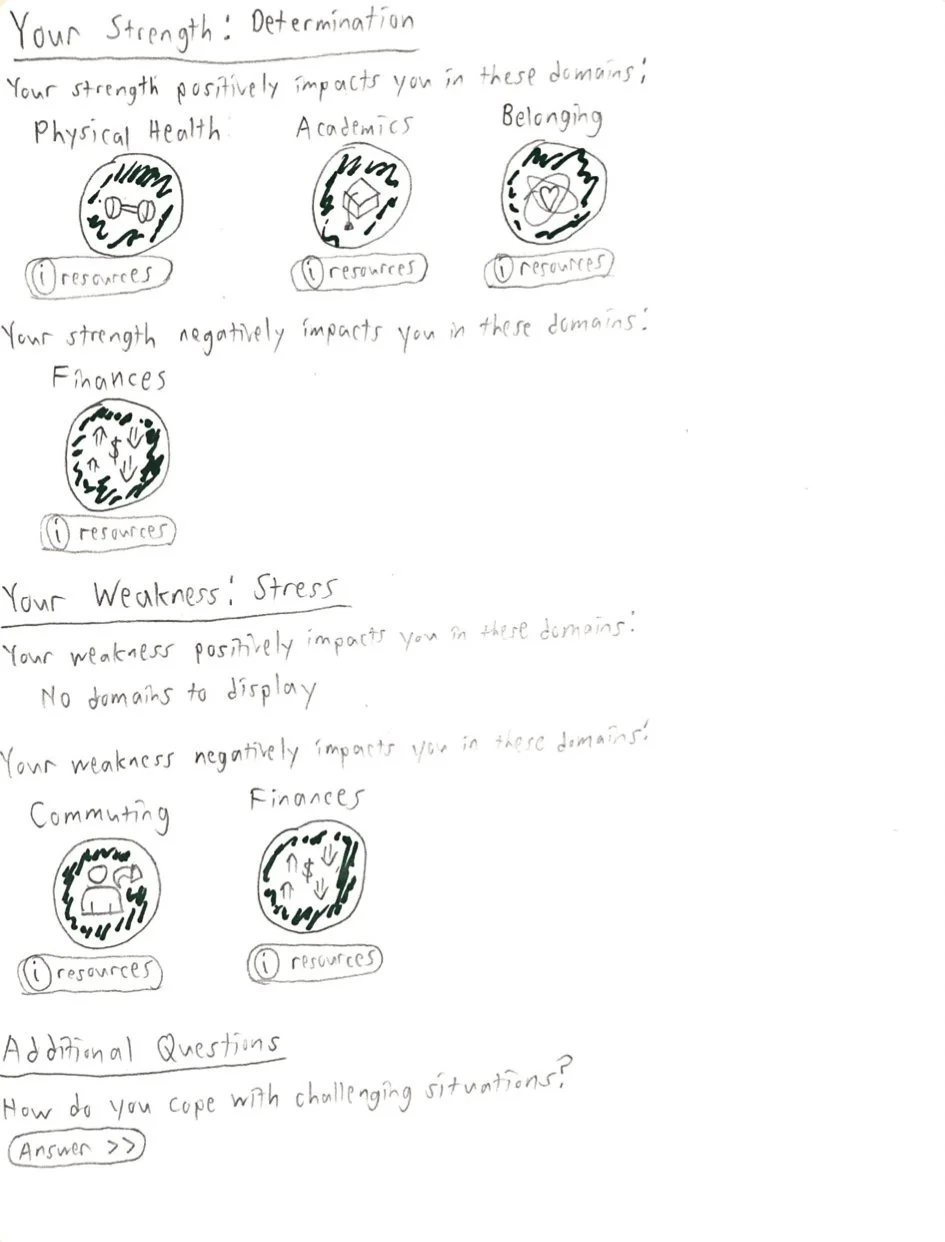
Student’s overall self-efficacy presented in each domain
Student’s self-efficacy dependent on strengths/weaknesses
Answers to additional questions presented in a concise manner
Initial Ideations: Summary Report
Word clouds of student strengths/weaknesses
Group-level student self-efficacy in each domain
Present resources that might be helpful to all students in the institution
Chosen Concepts for Wireframes
After conducting our initial research, our team produced several ideas and initial wireframes for how the users’ needs could be satisfied within the SeeDegree platform while fulfilling our client’s overarching objectives.
Initial Wireframes for the Individual Student
Overall, Improve the UI/UX of the client-side interface to enhance user experience for advisors
Provide better data visualization of student survey data for advisors to easily interpret
Integrate group-level and individual report features
Integrate the self-efficacy concepts from the student-facing survey
After ideating and choosing design concepts to pursue, each of our team members created their initial wireframes. The visuals from these wireframes were presented to the SeeDegree clients. They approved or disapproved of the qualities they believed would help achieve their goals.
Student profile Example 1
Student profile Example 2


Initial Wireframes for The Summary of Students

Ability to customize data graphics that show self-efficacy


Word clouds to quickly gauge common themes across the student population
Phase 3: Building and Testing
Initial Prototype Wireframe Examples
Usability Test and Results
After our client approved certain features from our initial wireframes, our team took these suggestions and created an initial prototype that we built using Figma. Our team then tested this prototype with the people in advisory roles that we initially interviewed in the research phase. To reiterate, advisory roles included academic advisors, advising deans, and an advising coach.


After participants were asked some identifying and demographic questions, they were then taken through a usability test with certain tasks. One team member relayed the tasks to the participant while another teammate took notes on any task difficulties or general observations. After all tasks were attempted, the participants were asked follow-up questions regarding their performance and questions about their thoughts on the product and how it can be improved for their job role.
Usability Test Findings
Evident navigation issues with the initial prototype
Trouble accessing resources provided to the students
The need for a notes feature for the advisor to keep notes on their students
The want for the ability to customize and personalize one’s interface according to their institution
The need for a possible change in the wording/language for how students’ results are portrayed
Phase 4: Finalize Designs
Refined Prototype: Individual Report

Individual student report with short AI generated summary and personalized information based on student’s efficacy report
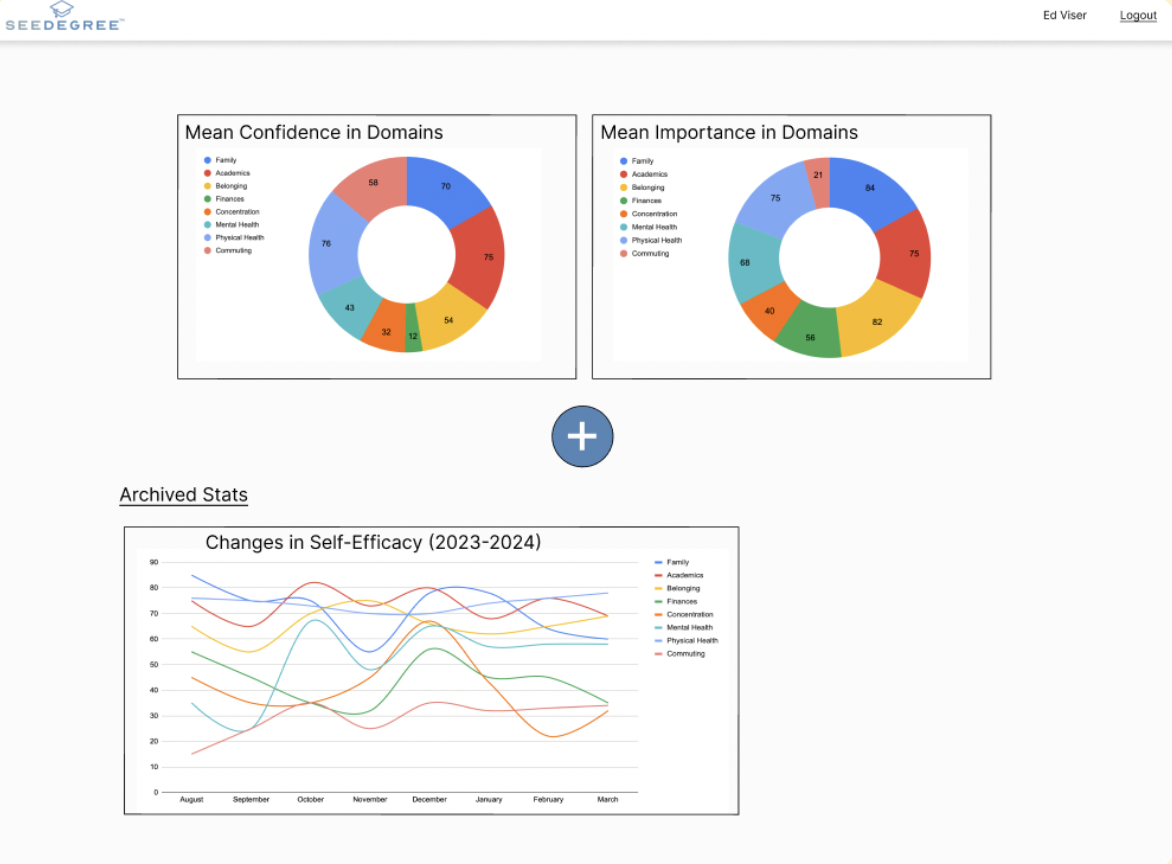
Refined Prototype: Summary Report
After testing with the participants in advisory roles, our team finalized our final interface designs based on the usability test findings that were observed and the recommendations that our participants suggested.

Notes feature that enables advisors to easily jot down key ideas during their meetings

Personalized strength and weakness report based on student survey
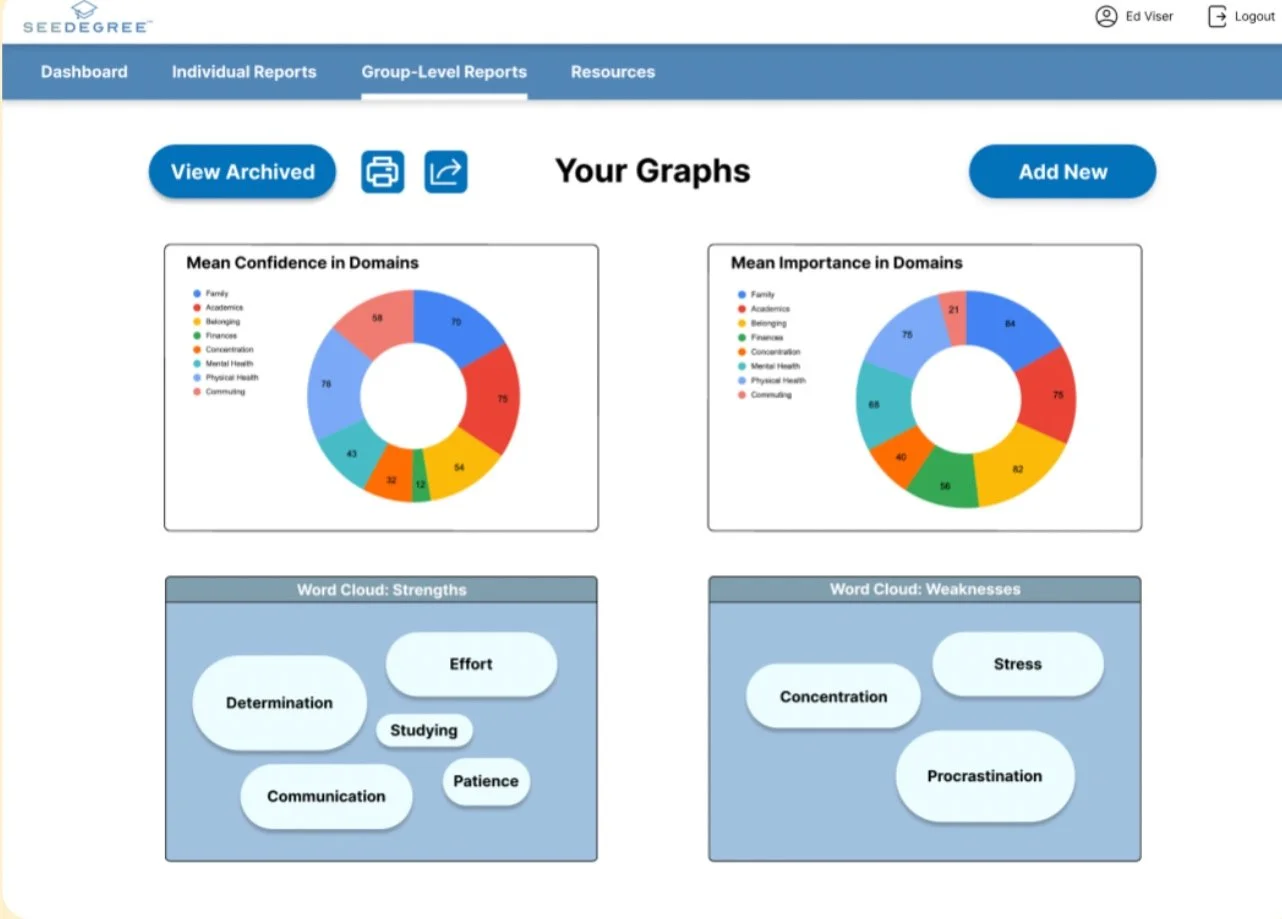
Customizable data graphics that show students’ overall self-efficacy and trends in different categories
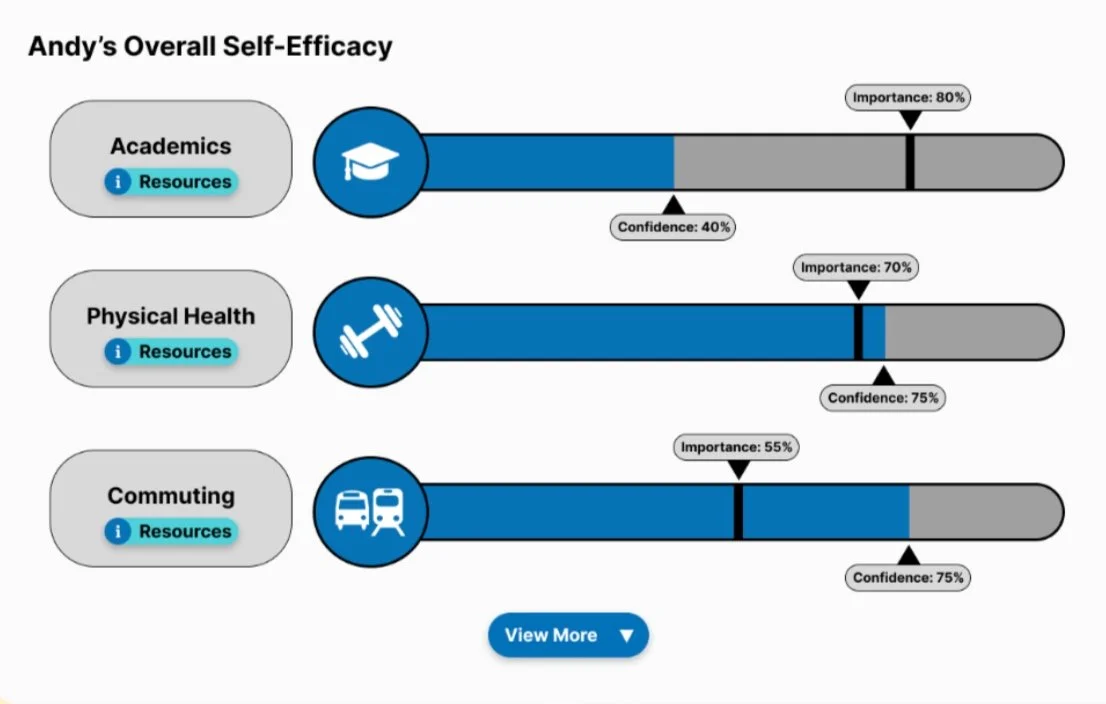
Overall self-efficacy report with confidence vs. importance statistics and resources provided by advisors
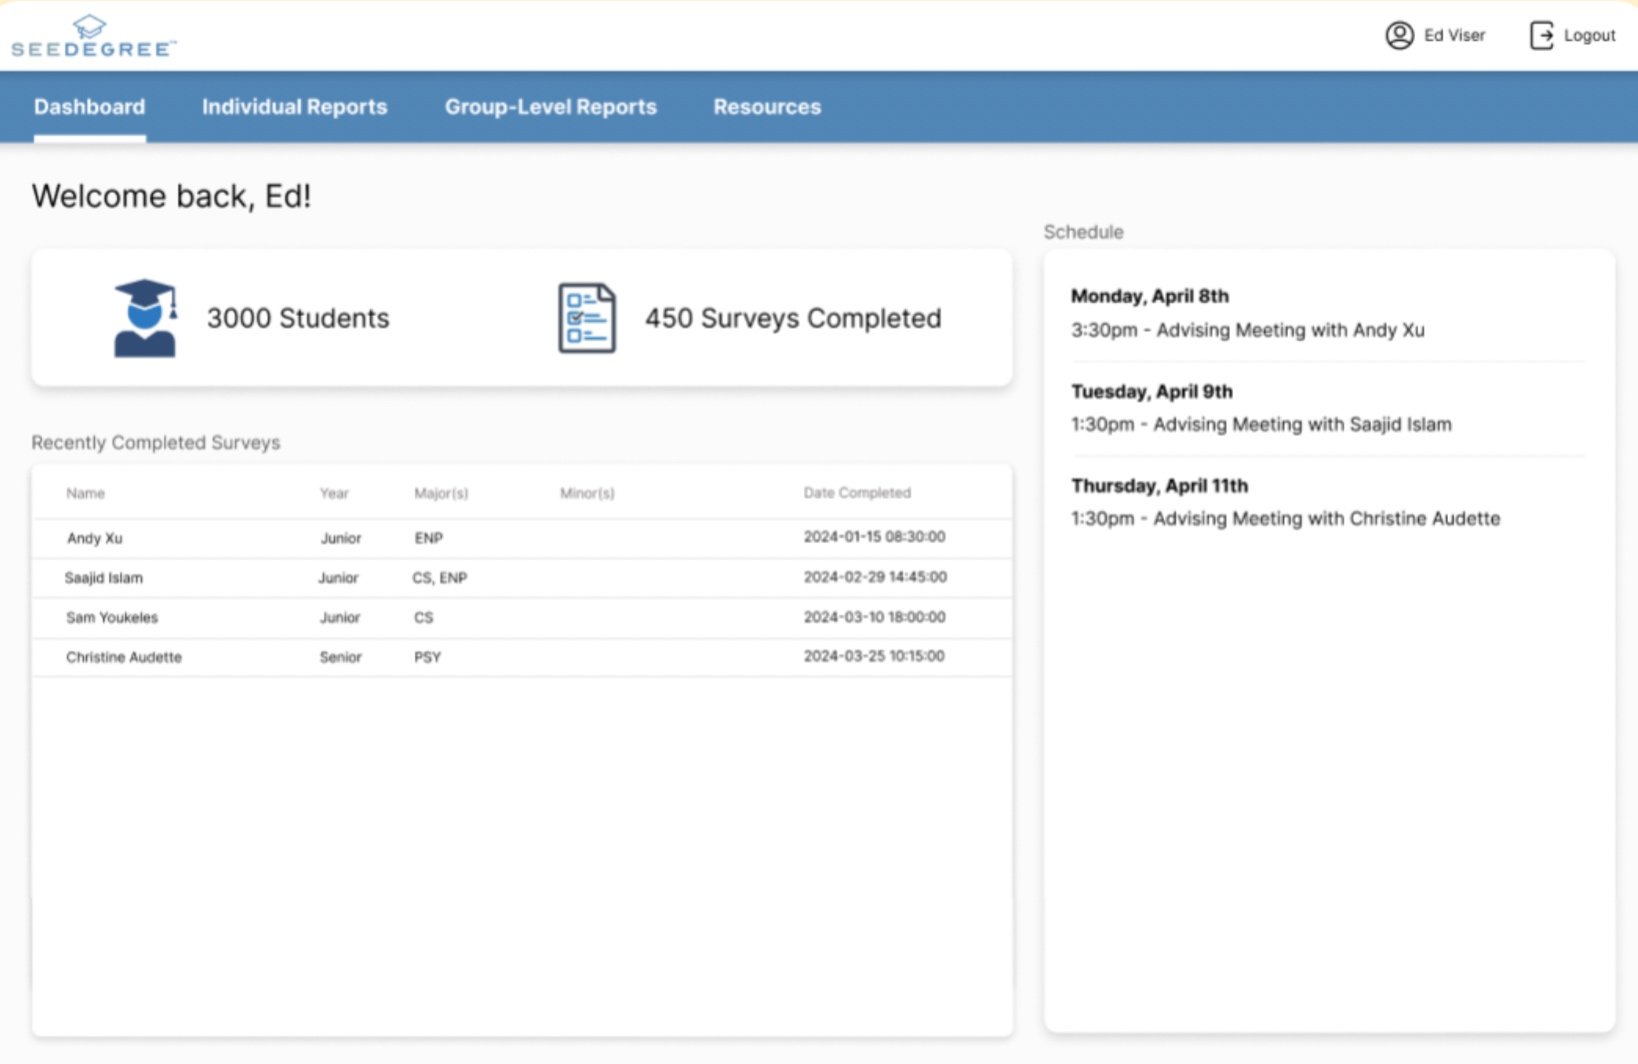
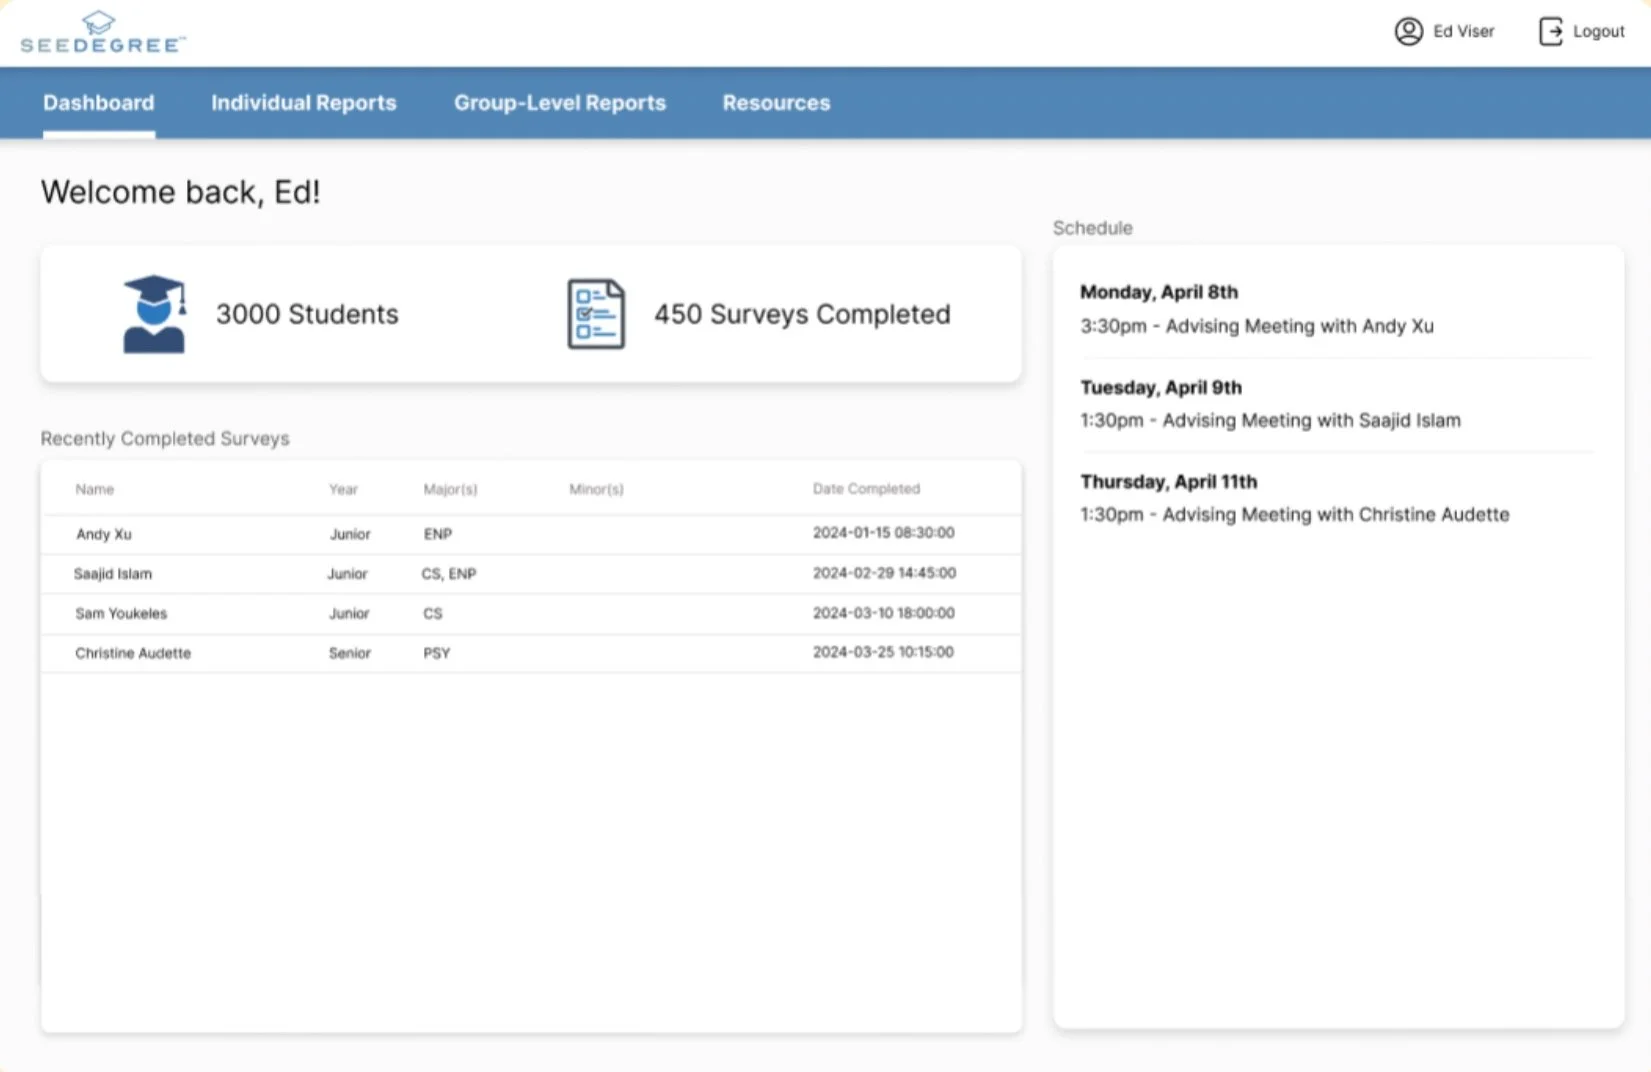
Database of advisors’ students
Conclusion
Overall, our team found…
Group level and individual evaluations of students are useful for different advisory roles
Taking notes on students is a crucial feature for advisors to recall student details
It’s important to create customized questions for students to answer related to their specific institution
In terms of next steps, we recommended…
Finding what types of graphs/features of the graphs should be built for the overall student report
Integrating the results from the additional customizable questions that students answer into the overall student report
Developing a communication feature between students, advisors, and potentially professors/teachers